 Fraunhofer Institute for Computer Graphics Research IGD
Fraunhofer’s CorASiV project comes out with new software to assist health departments in tracking chains of infection
Following the sudden rise of COVID-19 in recent weeks, doctors, government officials, and health departments are stressing the possibility of an uncontrollable spread of the virus and the consequences of a second lockdown. Those consequences are unforeseeable in terms of the impact to both the economy and public health. In anticipation, the federal government is repeating its desperate appeal from mid-April to focus on tracking the sources of infection and the spread of the virus. This is exactly where the Fraunhofer Institute for Computer Graphics Research IGD and the Fraunhofer Institute for Optronics, System Technologies and Image Exploitation IOSB come in with their solutions.
Their joint project, CorASiV, in which the Fraunhofer institutes IAIS, IME, ITWM, and MEVIS are involved, makes it possible to rapidly visualize data on those infected with coronavirus and the people with whom they have been in contact, and provides health departments with technology to effectively and comprehensively map the movement of the virus in the catchment area of a given district. The number of cases in Germany has recently taken a swift upward turn, with many cities and regions being classified as at risk. Since the outbreak of the novel coronavirus, health departments have been faced with a plethora of data that they need to input, compare, consolidate, and recall, yet they lack both the means and the personnel to do so: A health department employee must search for data or compare lists in an established computer system, which sometimes requires additional manual effort, in order to find specific individuals and those with whom they have been in contact and to compare this information. In addition to the already problematic lack of staff, this kind of time-consuming process takes up precious time for both staff and doctors.
Pioneering work on COVID-19 and Co.
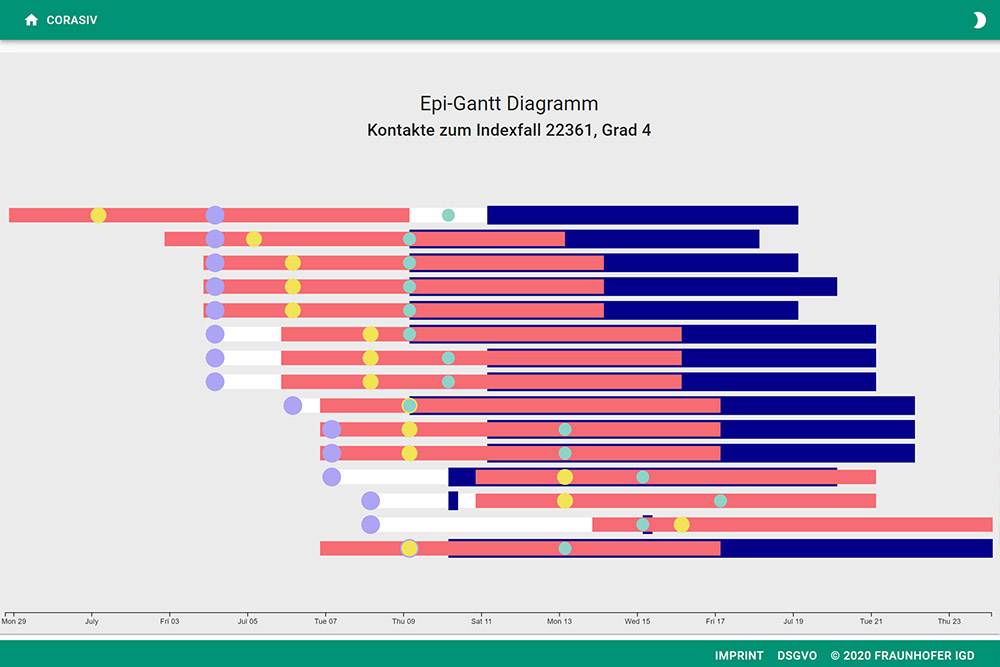
The technology in CorASiV digitally processes the data entered by a health department and visualizes it in various ways, while giving only health department employees access to personal data. All contacts and their addresses are displayed on a digital map along with their current infection status and the health department’s area is analyzed for potential local connections. A time-based visualization of the occurrence of infection can identify the individuals that have become infected around the same time. This gives health departments a better overview of the spread of the virus. The map visualization provides an overview of the occurrence of infection at the push of a button. This allows health departments to become more familiar with infection processes and adapt their countermeasures in a more targeted way.
CorASiV is a critical component in the full package of everything being done to contain the virus and is a real help to health departments. Thanks to the data already available, hotspots can be identified and new theories formulated on the mode of action of COVID-19. The system is also expandable: “You can break the picture down even finer,” said Dr. Jörn Kohlhammer, the person responsible for information visualization and visual analytics at Fraunhofer IGD in Darmstadt. “In terms of research, it has major potential, even for other health department projects, and can be applied to other infectious diseases.” Coronavirus will not be the last virus. One vision would be to expand the system to all of Germany. Data protection is guaranteed, since the data does not leave the network of the health department using it.
This software from the Fraunhofer institutes brings relief where digital solutions work best: in handling enormous, complex volumes of data. What health departments love most about these new tools is the amount of time they save.
As part of its “Fraunhofer vs. Corona” program, the Fraunhofer-Gesellschaft is assisting health departments in overcoming the coronavirus crisis. Health departments face the challenge of tracking and preparing available information on the spread of coronavirus and analyzing it with other sources of data. To help health departments do this, multiple Fraunhofer institutes pooled their expertise in medicine, data analysis, simulation, and visualization.
#WeKnowSolutions
At the Fraunhofer institutes’ digital trade fair #WeKnowSolutions, which will be held from October 26 to October 29, 2020 and center around the theme “Health. Digital economy. Systems and mechanical engineering. Mobility”, the “CoVAsiV” tool will be presented and demonstrated on:
Wednesday, October 28, 2020 for the third theme day (Health economy: rethinking medical processes)