 Fraunhofer Institute for Computer Graphics Research IGD
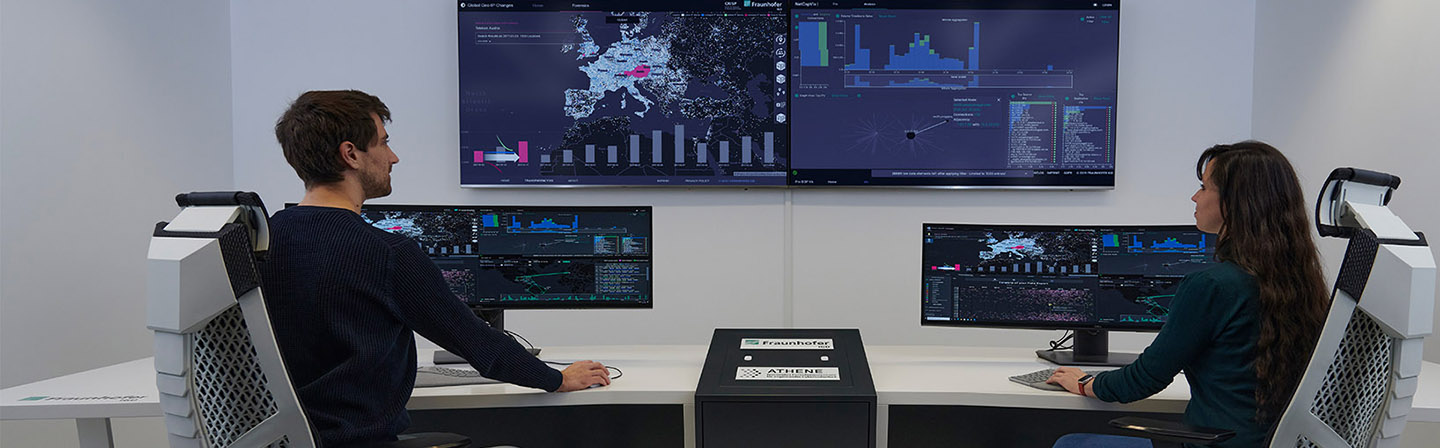
Cybersicherheit
A six-hour outage on the part of Facebook, Instagram and co. translated into a massive loss of revenue for their US-based parent company. What causes these infrastructure failures? And how can the root cause be detected and resolved as rapidly as possible? Germany’s ATHENE National Research Center for Applied Cybersecurity aims to make network data easier to understand—and to empower people to better analyze data traffic in their networks.
“It’s almost impossible to keep up with the sheer number of cybersecurity alerts generated in corporate networks,” says Professor Jörn Kohlhammer, ATHENE researcher at Fraunhofer IGD. The problem is that the vast majority of warnings are triggered by non-threatening anomalies in network traffic: “These false positives can crowd out notifications that do require action. The uncertainty around which alerts to address first is a really pressing issue.”
Delivering visibility into cybersecurity data
With such large volumes of data, it is not easy to maintain the necessary overview. Smaller enterprises, in particular, struggle to keep on top of their cybersecurity. Fraunhofer IGD believes the solution is to visualize security-relevant information in a more targeted way. Network data need to be made easier to understand so that more people can accurately assess what is going on in their networks. Within the scope of Germany’s ATHENE National Research Center for Applied Cybersecurity, Fraunhofer IGD is developing methods of effectively visualizing cybersecurity data. “The question guiding our research is: How can user interfaces be made simpler and better, so fewer specialist skills are required to monitor the security of one’s own network,” explains Kohlhammer. This expertise can benefit cybersecurity software developers, too. Further improving visualization for established software solutions increases their effectiveness—and user satisfaction. The goal is to create user interfaces that support very large data volumes and are tailored to the tasks of network administrators and security experts.
When not everything follows protocol
One example of unwieldy amounts of data is the Border Gateway Protocol (BGP). This routing protocol connects autonomous systems, and enables the internet’s cross-border data flows. Its vital role was highlighted by the Facebook services outage in October 2021. Configuration changes made by Facebook disrupted data exchange between its backbone of data centers and DNS servers. As there appeared to be a loss of connectivity, the servers stopped advertising BGP routing information. As a result, the DNS servers were inaccessible for an extended period, and Facebook’s services disappeared from the internet. Had there been better visibility into BGP notifications, that would not have happened.
Visual analytics makes life simpler for security experts
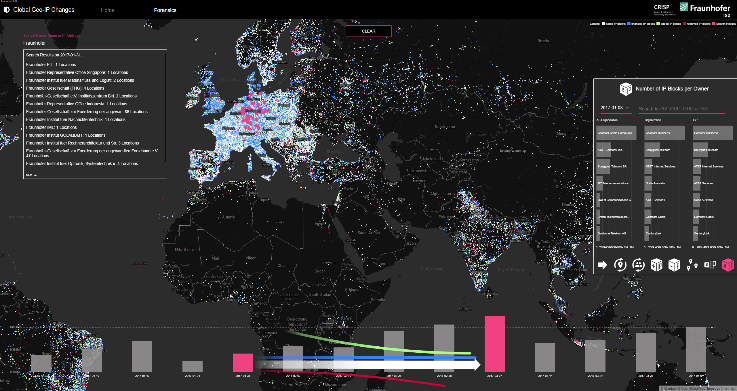
In association with the other ATHENE-member research institutions, Fraunhofer IGD offers a variety of visual analytics solutions. These enable cybersecurity professionals to visually and interactively assign alerts to defined groups—without having to scroll through long lists, and without having to evaluate each individual alert. The NetCapVis tool visualizes network data sorted by criteria such as IP address or data format. A timeline shows when data packets enter or leave the network. This provides network administrators and security experts with an at-a-glance overview—allowing them to respond in a targeted manner to unfamiliar or unusual data traffic. And in the digital age, with the number of attacks on businesses and public organizations on the rise, that is more important than ever.