Field research
Agriculture is increasingly becoming one of the closely monitored domains in Europe and the United States. Satellite data, sensors and historical values today allow crop growth to be recorded sometimes down to the centimeter. However, the growing volume of data is also becoming a problem, since recording and processing it is becoming increasingly complex. In its pilot project DataBio, Fraunhofer IGD is working on ways to nevertheless effectively process data for agricultural operations, government agencies and insurance companies.

The most extensive list of weather sayings currently has over 3,000 entries. Every one of them stands for the desire to be able to derive reliable findings from observations. Every one seeks to impart insight into what could be done to improve one’s agricultural situation. Yet, regardless of whether some are accurate and others are just hogwash: These handed-down methods naturally have long since been inadequate for making developments in agriculture, forestry and even fishery predictable, more controllable and more efficient. This is why agricultural and forestry operations these days use a wealth of mostly automatically generated data. And this amount keeps growing. Sensors placed throughout the land that record temperature conditions on the ground or determine plant moisture, historical and forecast weather information or satellite images in various spectral ranges, each of which provides different knowledge, allow stock to be taken of the situation of individual operations or entire swaths of land, sometimes down to the centimeter. This is, in essence, not only interesting/useful for “precision farming”¾ predictive, intelligently measured output of seed and fertilizer¾but also generally to get the most out of soil conditions, land use and weather situations. This makes not only agriculture more resource-efficient and effective, the data is also of extreme value to government agencies and insurance companies. Examples include back in the searing summer of 2018, when the ministry wanted to determine the actual agricultural losses in a region, or when insurance companies need to determine the cause and scope of damages from extreme weather events or diseases have descended upon entire tracts of land or even individual parcels.
Analyzing the situation in the fields
The advantage of all this obtained data, which, in extreme cases, currently contains information describing the situation by the square meter or even cataloging it down to the plant, is also a decisive disadvantage: its abundance. “In some circumstances, the extent of the data may only be a few gigabytes on a hard drive. Nevertheless, the high number of records poses particular challenges to data management and analytical tools,” emphasized Ivo Senner of the Fraunhofer Institute for Computer Graphics Research IGD in Darmstadt. At the institute’s Spatial Information Management, Senner works alongside colleagues from Fraunhofer and 50 partner institutions in science and business on the Data-Driven Bioeconomy project, or DataBio for short. The goal is to provide an optimal technical infrastructure for searching, accessing, processing and visualizing very large quantities of data in the area of bioeconomy. DataBio is part of the European Commission’s research program Horizont 2020 and is being conducted in cooperation with the Big Data Value Association (BDVA).
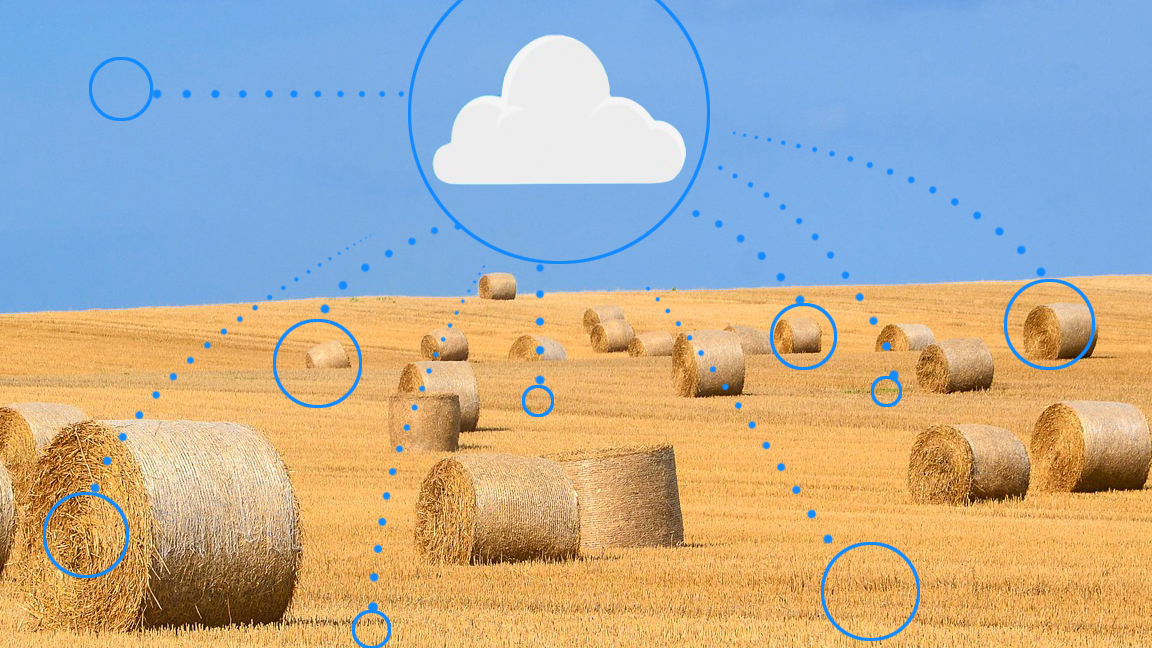
Fraunhofer IGD is primarily working on methods and concepts for cloud computing and big data to accelerate the storage, processing and visualization of spatial databases--some of which are markedly differentiated--as well as make them easier to use and facilitate the interpretation of data correlations. The aim is to make growth figures, water and nutrient content, or even the “health” of individual fields or entire regions easier to access and use.
DataBio starts field test in Greece
The dimension the researchers are facing is illustrated by a pilot project of DataBio in which Fraunhofer IGD is participating. In this pilot project, a total of 50,000 fields in Greece with different types of plants will be charted. Every 14 days, millions of pieces of data will be collected and then processed in various ways and made interactively usable for different interest groups on regular PCs or tablets. The researchers at Fraunhofer IGD will accomplish this through a combination of different techniques, among other measures. “For example, we’ll first employ a high level of data compression while also making it possible to query separate areas on demand in the cloud,” explained Senner. This will ultimately give the data systems a form of artificial intelligence that assumes that of course not all data will be needed on an end device. But one that, in cases of selective interest, can also supply details immediately and establish correlations with other data. In this manner, the researchers are also giving users the ability to display informative, visual conversions of the recorded data, to draw specific initial conclusions about the local situation from a visual inspection, for example. Hot spots, such as during droughts or after hailstorms, can then be quickly identified by concerned parties and insurance companies. Even subvention management will be made easier. “While we may be in the middle of the project at the moment and thus still in the development phase, the first very informative results are already giving us a very good basis for further research,” emphasized Senner. Plans now include broadening and deepening the method, as well as significantly more comprehensive analyses for what will be up to three million fields.
 Fraunhofer Institute for Computer Graphics Research IGD