 Fraunhofer Institute for Computer Graphics Research IGD
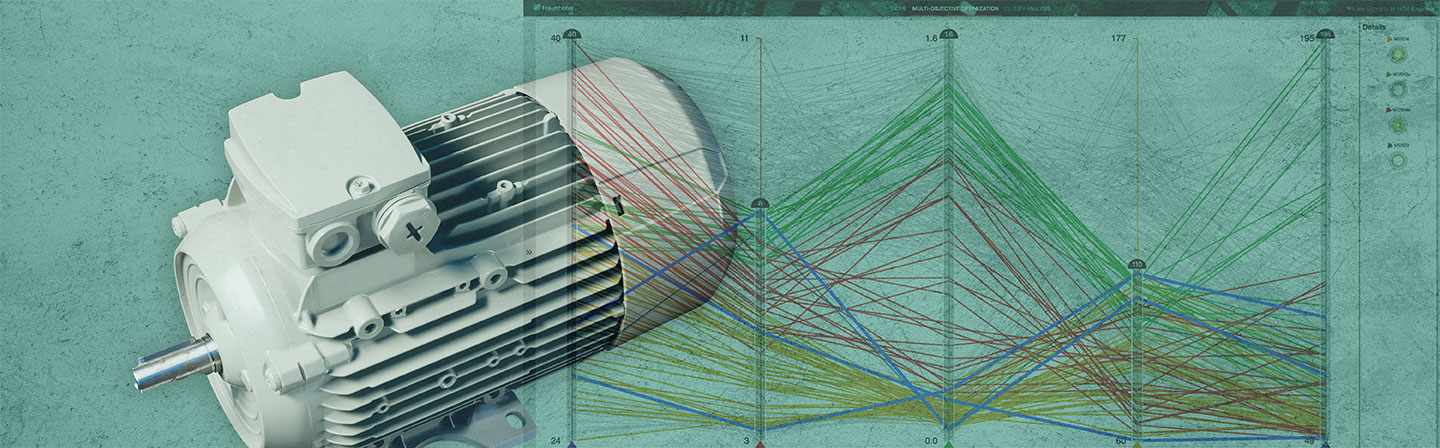
Product development: decision-making and communication in view of conflicting quality criteria
Decisions are rarely made easily, especially when criteria are in conflict -- the visualization of alternatives helps organize thoughts. A tool by Fraunhofer IGD is making it easier for engineers to find the optimal design of a commissioned product, and allows for transparent, straightforward cost-benefit comparisons that reduce decision-making time.
(Darmstadt) An engineer is designing an electric motor that meets the nominal criteria specified by the client. Her presumption that a different material or geometry might further benefit the motor’s performance is confirmed in simulations. How does she, however, report this to the client, who will be skeptical towards the increased costs associated with the change?
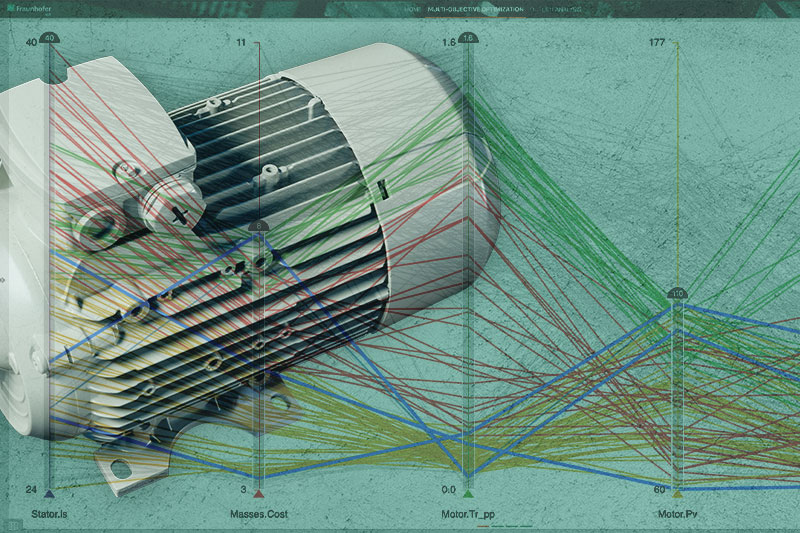
The solution: a clear visualization of the alternatives that offers composite filters to quickly drill down to the preferred design candidates. Dragging a slider to increase acceptable cost, for example, causes the visualization to seamlessly display the effects on the motor’s remaining properties. This enables decision-makers to identify the advantages and drawbacks of specific designs at a glance, without the need for in-depth expertise. Customer and engineer can decide based on the envisioned application: If efficiency, for example, is less critical, a more affordable motor design may be chosen.
The interactive controls of the visualization help clarify decision-making processes and significantly reduce coordination time in the face of multi-criteria cost-benefit trade-offs.
Interactive visualization that focuses on decision-makers
In order for a visualization to effectively support a human analysis process such as decision-making, the real-life domain characteristics need to be taken into consideration. For this purpose, the tasks, work flows, and needs of domain experts are analyzed to derive requirements that have to be met by a visualization. Based on this characterization, suitable visualization approaches can be chosen and tailored to the application domain. The presented visualization was developed in close collaboration with engineers from the Linz Center of Mechatronics over a period of one and a half years. Thanks to this collaboration, a tailored solution was born that can be seamlessly integrated into existing analysis processes and work flows. How this user-centered process has been successfully implemented can be read about in our researchers’ journal article entitled “PAVED: Pareto Front Visualization for Engineering Design”.