 Fraunhofer Institute for Computer Graphics Research IGD
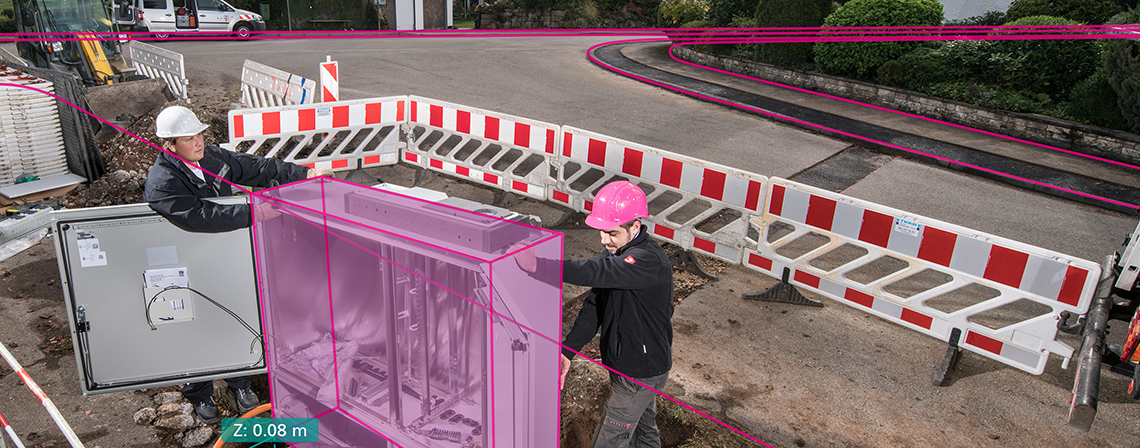
Fibre3D: visual support for fibre-optic expansion
(Darmstadt) Two million households are slated to enjoy faster online speeds by 2021 thanks to fiber-optic Internet. Fraunhofer IGD’s visualization tool, Fibre3D, is making the necessary network planning easier.
The rollout of a nationwide fiber-optic Internet infrastructure has been proceeding at a sluggish pace for a number of reasons, with extensive planning phases being among them. Scores of approval rounds and on-site tours have been centered around what the best possible fiber-optic network layout could look like.
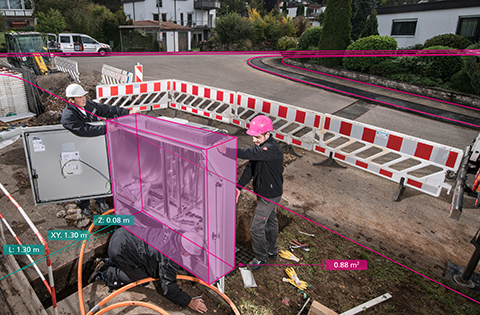
Especially in the field of infrastructure planning, it has been shown that planning and approval processes that utilize interactive visualization technology are much more efficient than those using conventional systems. One example of this technology is Fibre3D, an interactive 3D application developed by the Fraunhofer Institute for Computer Graphics Research IGD. In addition to a three-dimensional map view, it offers various measuring and editing tools that allow planners to work in any potential expansion area digitally instead of having to take laborious on-site measurements.
To create the digital map material, infrastructure service providers are even now using vehicles with special cameras that drive down entire streets and image the surroundings with a laser scanner. Due to the enormous volume of data, however, visualization has thus far been limited to a 2D representation that does not allow for important spatial coordinates, such as distances between objects.
Three-dimensional view with considerably more information
With Fibre3D, the researchers are Fraunhofer IGD have developed a web-based 3D visualization tool that clearly displays all relevant information, along with a wide range of attributes.
To properly process the tremendous amount of data, the developers supply not only the visualization but also the corresponding infrastructure, using the computing power of the cloud to scale down the data volume and filter out the information needed for three-dimensional representation. This step forms the basis for Fibre3D to guarantee an online visualization processed in real time.
“With our web-based viewer, Fibre3D, planners see the autogenerated network in front of them in three dimensions,” explained Pascal Bormann, researcher at Fraunhofer IGD. “In addition to spatial coordinates, the tool displays environmental information, such as sidewalks, buildings and streetlights, so it doesn’t just generate an improved view, it provides considerably more information than current programs.”
Necessary documents generated automatically
The systems currently in use are already reaching their limits, even at Deutsche Telekom. The amount of data to manage is so large that important and relevant information cannot be displayed at a glance. Rather, the planners at Deutsche Telekom only see a two-dimensional display, similar to a 2D road map, with plenty of relevant and, in principle, available information going unused. When it comes to getting a planned network approved by a local government, an on-site tour is needed. The fiber cabinets required for cabling, for example, are roughly placed on the 2D road map during the planning phase without regard to on-site conditions. Only by visiting the sites is it ensured that cabinets are not set up in absurd locations, such as in front of windows or doorways.
“With Fibre3D and its infrastructure also working in the background, our planners and the approval authorities can get a realistic impression of the planned fiber-optic network on the streets without having to take time to tour every single road in person,” said Niko Gitzen from Deutsche Telekom Technik GmbH. “Thanks to Fibre3D, it will now also be possible for us to automatically generate the documents we need, including pictures, for approval of new networks and shorten the time-consuming planning phase significantly.”
The Fibre3D tool is scheduled for release in 2020. The developers will present the application at its own stand at the INTERGEO trade fair in Stuttgart, Germany, from September 17 to 19, 2019 (Hall 01, Booth C076) and at the INTERGEO conference on September 18.