 Fraunhofer Institute for Computer Graphics Research IGD
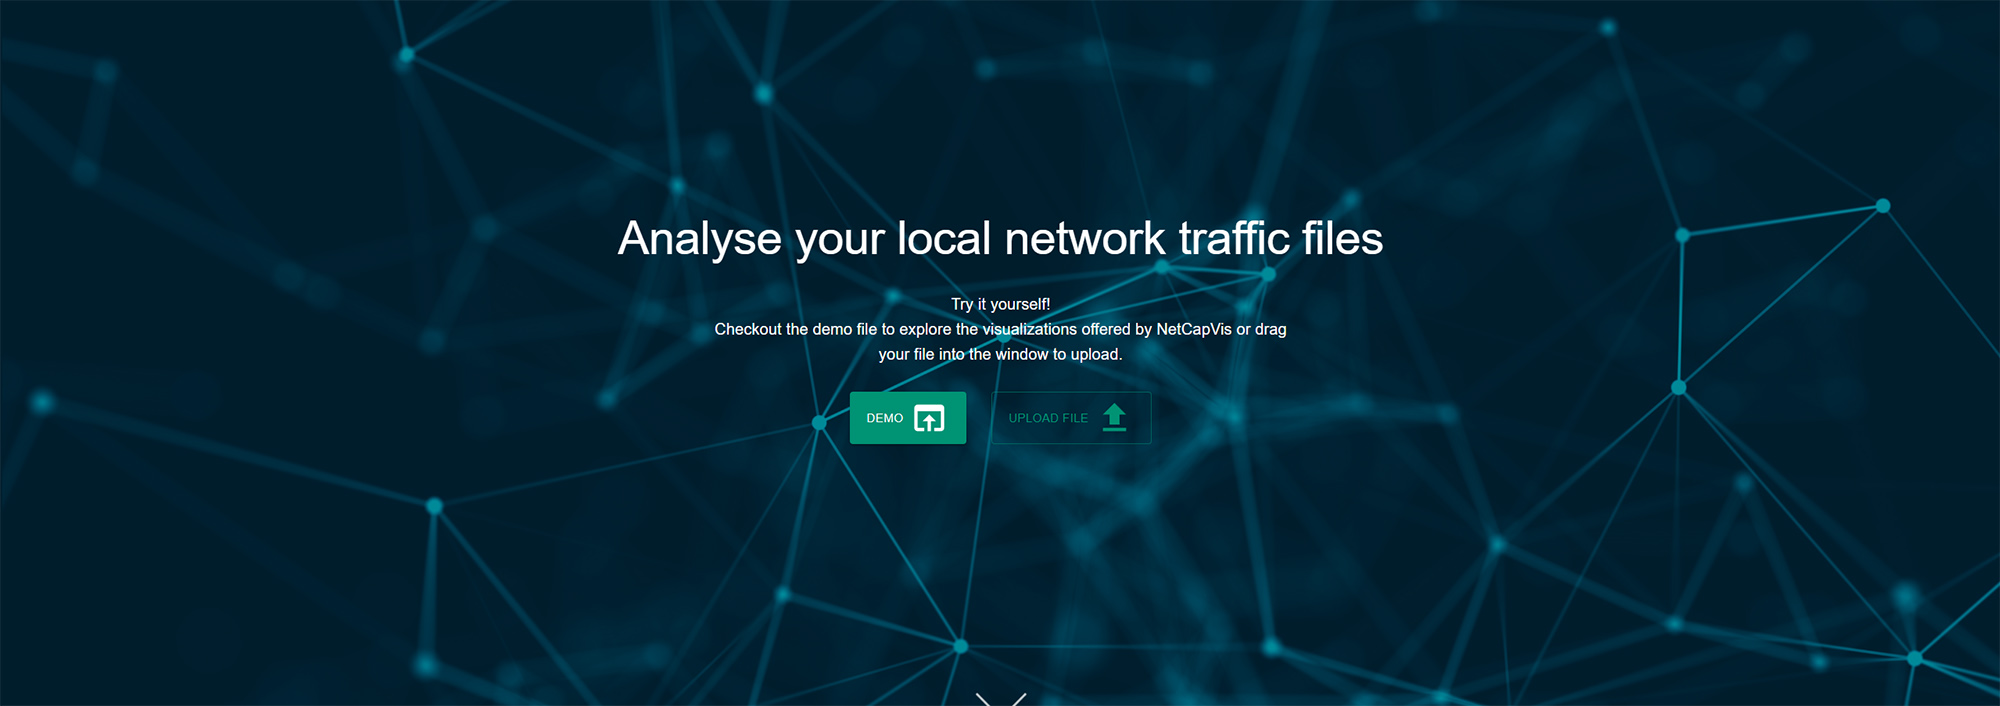
Software from Fraunhofer: NetCapVis
Time-saving solutions for IT problems using visualized data streams and AI
The NetCapVis solution from Fraunhofer IGD makes it possible for users to analyze data streams and uncover sources of errors in their own network without having to check through endless columns of numbers. It simplifies the work of IT staff, especially in small to medium-sized enterprises and in local government. This is because the visual and interactive design is easily accessible, even where the user lacks in-depth specialist knowledge. Fraunhofer IGD will be presenting this and other solutions at the IT security trade fair it-sa Expo&Congress in Nuremberg (10th 12th October).

Darmstadt/Nuremberg: If a computer paralyzes the entire network or if files sent by unknown persons are downloaded, that’s when the tedious process of troubleshooting begins. It is a challenge that is often beyond the capabilities of security staff in organizations without their own IT department. Researchers at the Fraunhofer Institute for Computer Graphics Research IGD have set themselves the task of mitigating the challenge and have developed NetCapVis, a solution that simplifies the analysis of network data.
Network analysis made easy
“Our aim was to design the user interface in such a way that it is accessible and easy to operate, even with moderate IT skills,” explains Alex Ulmer, chief developer of NetCapVis and researcher at Fraunhofer IGD. “The software complements the open-source tool Wireshark, which many companies and municipalities already have. With NetCapVis as an add-on, they can fully exploit the potential and make network analyses more transparent.”
For example, information can be filtered according to criteria such as IP addresses or data format. A timeline shows the times at which data packets enter or leave the network. Ulmer and his team have trained an artificial intelligence to recognize which application creates which type of packet. This makes it possible to quickly identify the program that is causing a particular problem. The on-screen tabular layout, which is what many users appreciate about Wireshark, also forms part of the Fraunhofer software. Professor Jörn Kohlhammer, Head of the Information Visualization and Visual Analytics department explains further: “With NetCapVis, we are closing a gap between free but not always straightforward software solutions that are only of interest to large companies due to their cost structure.”
Uncomplicated integration into existing system landscape
Visitors to it-sa in Nuremberg can see the software in demo mode. By scanning a QR code, they have the opportunity to test the prototype – in a limited form – at home with their own data. If organizations are inspired to use the full version of the software afterwards, several options are open to them. “The tool is scalable,” adds Ulmer. “From simple online use for a basic license fee to on-premise integration in the customer’s own network, where all data remains with the user.”
On the first day of it-sa, Kohlhammer will also give a presentation (starting at 9.45 a.m.) on use-centric applications of visual analytics in cybersecurity, also featuring other exhibits he has brought along from the institute, including TransparencyVis. This is a technology that allows users to visualize their own personal data exports from various online services. In the context of the ATHENE National Research Center for Applied Cyber Security, the Fraunhofer team have also been conducting research into the visual analysis of vulnerabilities in software.